Gross Rent Multiplier by City & Zip Code
2026 Benchmarks
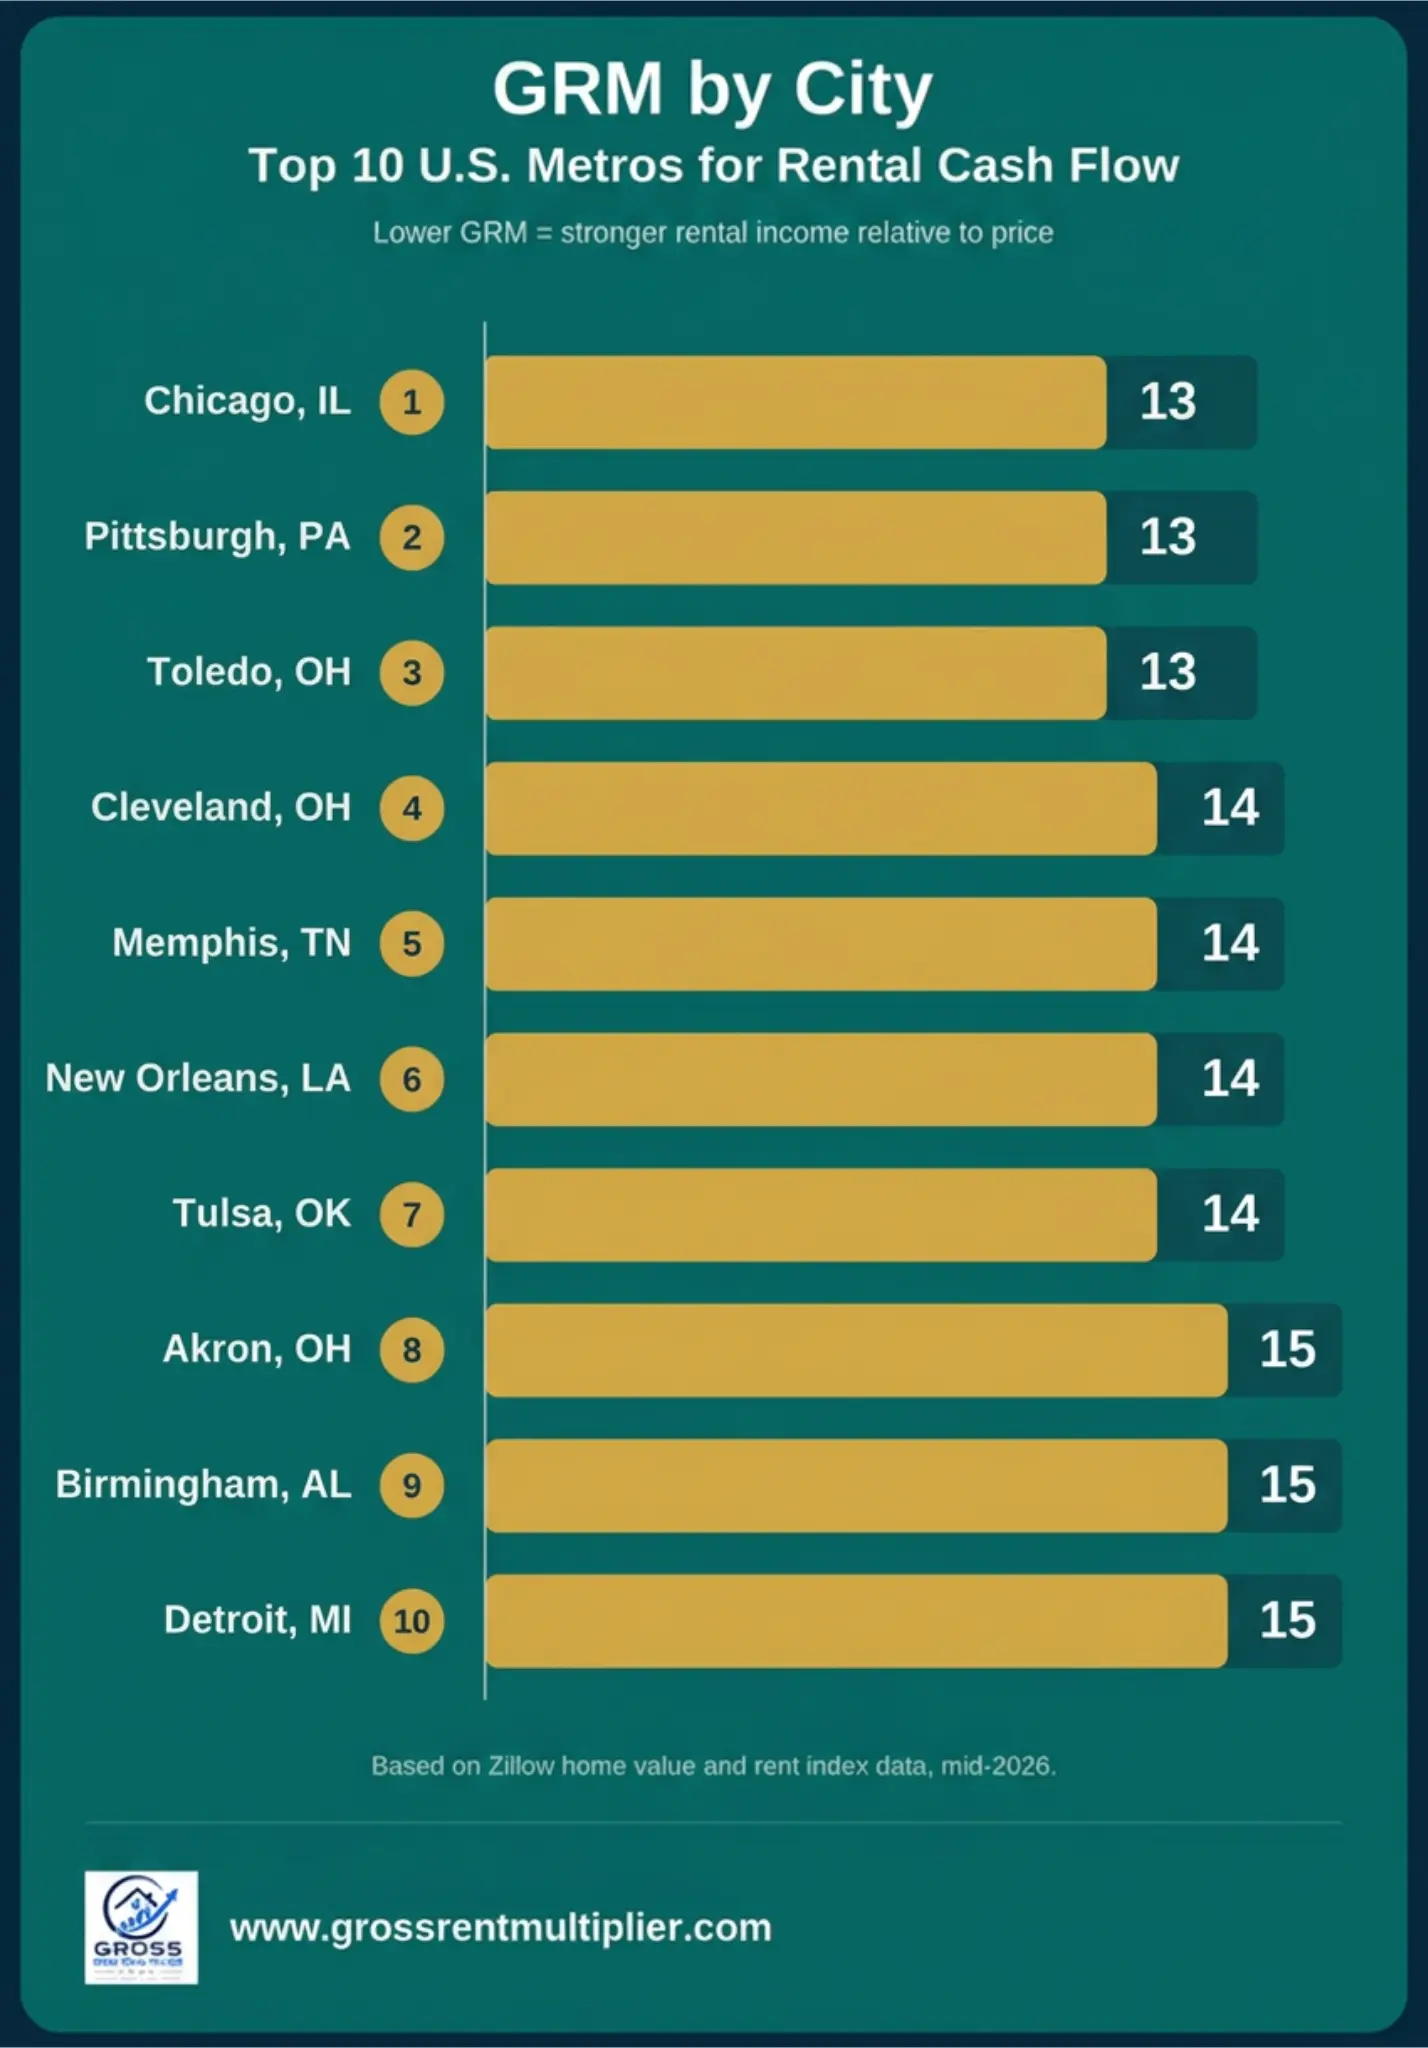
Gross Rent Multiplier shifts significantly across markets because it reflects local price-to-rent dynamics — shaped by demand, income levels, and how much of an area's appreciation story investors are pricing in. A GRM of 8 might be strong in one metro and mediocre in another, and even different zip codes within the same city can show meaningfully different GRMs. Always compare against local, not national, benchmarks.
One of the most common mistakes investors make with Gross Rent Multiplier is treating it like a single universal number. In reality, GRM is deeply local — a figure that looks excellent in one city can be completely unremarkable a few states away, and even neighboring zip codes in the same metro can tell very different stories.
This guide breaks down why gross rent multiplier by city and zip code varies, what typical ranges look like across different city types, and how to build your own reliable local benchmark before evaluating any specific property.
Why GRM Varies by Location
GRM reflects the relationship between what a property costs and what it rents for — and that relationship is shaped by forces that differ enormously from one market to the next. Because gross rent multiplier by city (and even by zip code) can swing so widely, savvy investors always calculate it at the local level before making a decision.
- Local demand — high-demand metros push prices up faster than rents, raising GRM
- Income levels — areas with strong wage growth can support higher rents relative to price
- Housing supply — constrained supply markets tend to show higher GRMs than markets with abundant new construction
- Investor appetite for appreciation — markets where buyers are pricing in future appreciation often show higher GRMs than pure cash-flow markets
- Interest rate sensitivity — markets more exposed to financing costs can see GRM shift as rates change
Two identical GRM figures in different cities can represent very different investment realities. Always pair a GRM number with the local context that produced it — never treat it as a portable, one-size-fits-all benchmark.
GRM Benchmarks by City Type
While every submarket is different, city types tend to cluster into broad bands. Use this as a general orientation — not a substitute for actual local comparable sales. For more on what counts as a strong GRM in any given context, see our What Is a Good GRM? guide.
| City Type | Typical GRM Range | Characteristics |
|---|---|---|
| Smaller Midwest / Southern metros | 5× – 8× | Cash-flow oriented |
| Mid-sized growth cities | 7× – 11× | Balanced |
| Large coastal metros | 12× – 18× | Appreciation-driven |
| Premium urban cores | 16× – 25×+ | Thin yield, high appreciation bet |
Zip Code Level Differences
Citywide averages can hide meaningful variation within a single metro. A downtown zip code with strong walkability and new construction can carry a materially different GRM than a suburban zip code twenty minutes away — even though both fall under the same city-level statistic.
| Zip Code Profile | Typical Pattern |
|---|---|
| Downtown / urban core | Higher GRM — priced for appreciation and lifestyle demand |
| Established suburban | Moderate GRM — balanced cash flow and stability |
| Emerging / up-and-coming | Lower GRM initially, often compressing as demand catches up |
| Rural / exurban | Lower GRM — stronger cash flow, slower appreciation |
How to Find Local GRM Data
- Pull recent comparable sales — 8 to 10 similar properties sold in the last 6 to 12 months in your target zip code
- Calculate GRM for each comp — use our free GRM Calculator to speed this up
- Average the results — this becomes your local benchmark for that specific submarket
- Talk to local agents and property managers — they often have informal but reliable local rent and price intuition
- Cross-check with public housing data — the U.S. Census Bureau's housing data can help validate local rent trends
- Re-check periodically — local benchmarks shift as rates, supply, and demand change
Comparing Two Markets — A Worked Example
| Feature | Market A — Growth Metro Suburb | Market B — Established Midwest City |
|---|---|---|
| Median Property Price | $520,000 | $220,000 |
| Median Annual Rent | $42,000 | $27,500 |
| GRM | 12.4 | 8.0 |
| Investor Read | Appreciation-leaning | Cash-flow leaning |
Neither market is objectively "better" — they represent different investment theses. Market A's higher GRM reflects an appreciation-driven market where investors are willing to accept thinner rental yield for long-term price growth. Market B's lower GRM signals a market where cash flow, not appreciation, is the primary draw. The right choice depends on your investment goals, not the GRM number in isolation. This is exactly why comparing gross rent multiplier by city matters more than leaning on a single national figure.
Common Comparison Mistakes
- Using national averages instead of comparing gross rent multiplier by city against local comparable sales
- Relying on citywide data instead of comparing gross rent multiplier by city at the zip-code level, where it's available and more relevant
- Comparing across property types — single-family vs multifamily GRMs shouldn't be benchmarked against each other
- Using outdated comps — local gross rent multiplier by city benchmarks shift as markets move, especially in fast-changing metros
- Ignoring the "why" behind a high or low GRM — a number alone doesn't explain whether it reflects opportunity or risk
Tips for Local Market Research
- Build a spreadsheet tracking GRM by zip code for your target markets over time
- Cross-check GRM trends against local rent growth and vacancy data
- Pair GRM findings with cap rate research once you've shortlisted a specific submarket
- Revisit your local benchmarks quarterly — markets can shift meaningfully within a year
- When comparing markets for a buy-and-hold versus appreciation strategy, weigh GRM alongside your actual investment goals — see how financing changes the picture in our GRM vs Cash-on-Cash Return guide
People Also Ask
Not necessarily — a low GRM in a declining market can reflect genuine risk, not opportunity. Always pair the number with an understanding of why that market's GRM sits where it does.
Meaningfully shifting markets can see benchmark changes within a single year, especially where interest rates or local supply are moving quickly. Slower-changing markets may stay fairly stable for longer.
Frequently Asked Questions
Enter any property price and rent — get your GRM instantly, then repeat for a handful of local comps to build a reliable benchmark. Free, no sign-up required.
Calculate GRM Now — It's Free